NBA analytics / Data modeling
Comparing NBA players by role and playing time
I built a database of player game records and a method for comparing season performance. Expressing statistics per 36 minutes and using historical benchmarks for different player roles gives those comparisons a consistent basis.
- Context
- Independent basketball analytics project using historical box scores.
- Problem
- Make player comparisons repeatable across a defined population and set of statistics.
- My contribution
- Database design, comparisons normalized for playing time, inferred roles, and historical benchmarks.
- Result
- About 1.67 million player-game records in the documented local build, with season-level comparison rules.
A consistent record for each player and game
Comparing players requires a consistent connection between box-score performance, players, teams, games, and dates. I designed a star schema, with a central performance table linked to those descriptive tables, so repeated analyses could use the same structure.
Each performance row represents one player in one game. The benchmark analysis combines those rows into player-seasons: one player’s statistics across a season. The project uses DuckDB and PostgreSQL.
Organizing the comparison
Player performance
One player, one game
Why player roles change the comparison
I expressed statistics per 36 minutes so players with different playing time could be compared on the same basis. That is a normalization of recorded performance, rather than a promise of what someone would produce if they played longer.
The model infers three basketball roles: creators, wings and bigs. These broadly represent playmaking, perimeter and interior roles. In the historical chart, four assists per 36 minutes is around the 95th percentile for bigs, while the median for creators is 5.2.
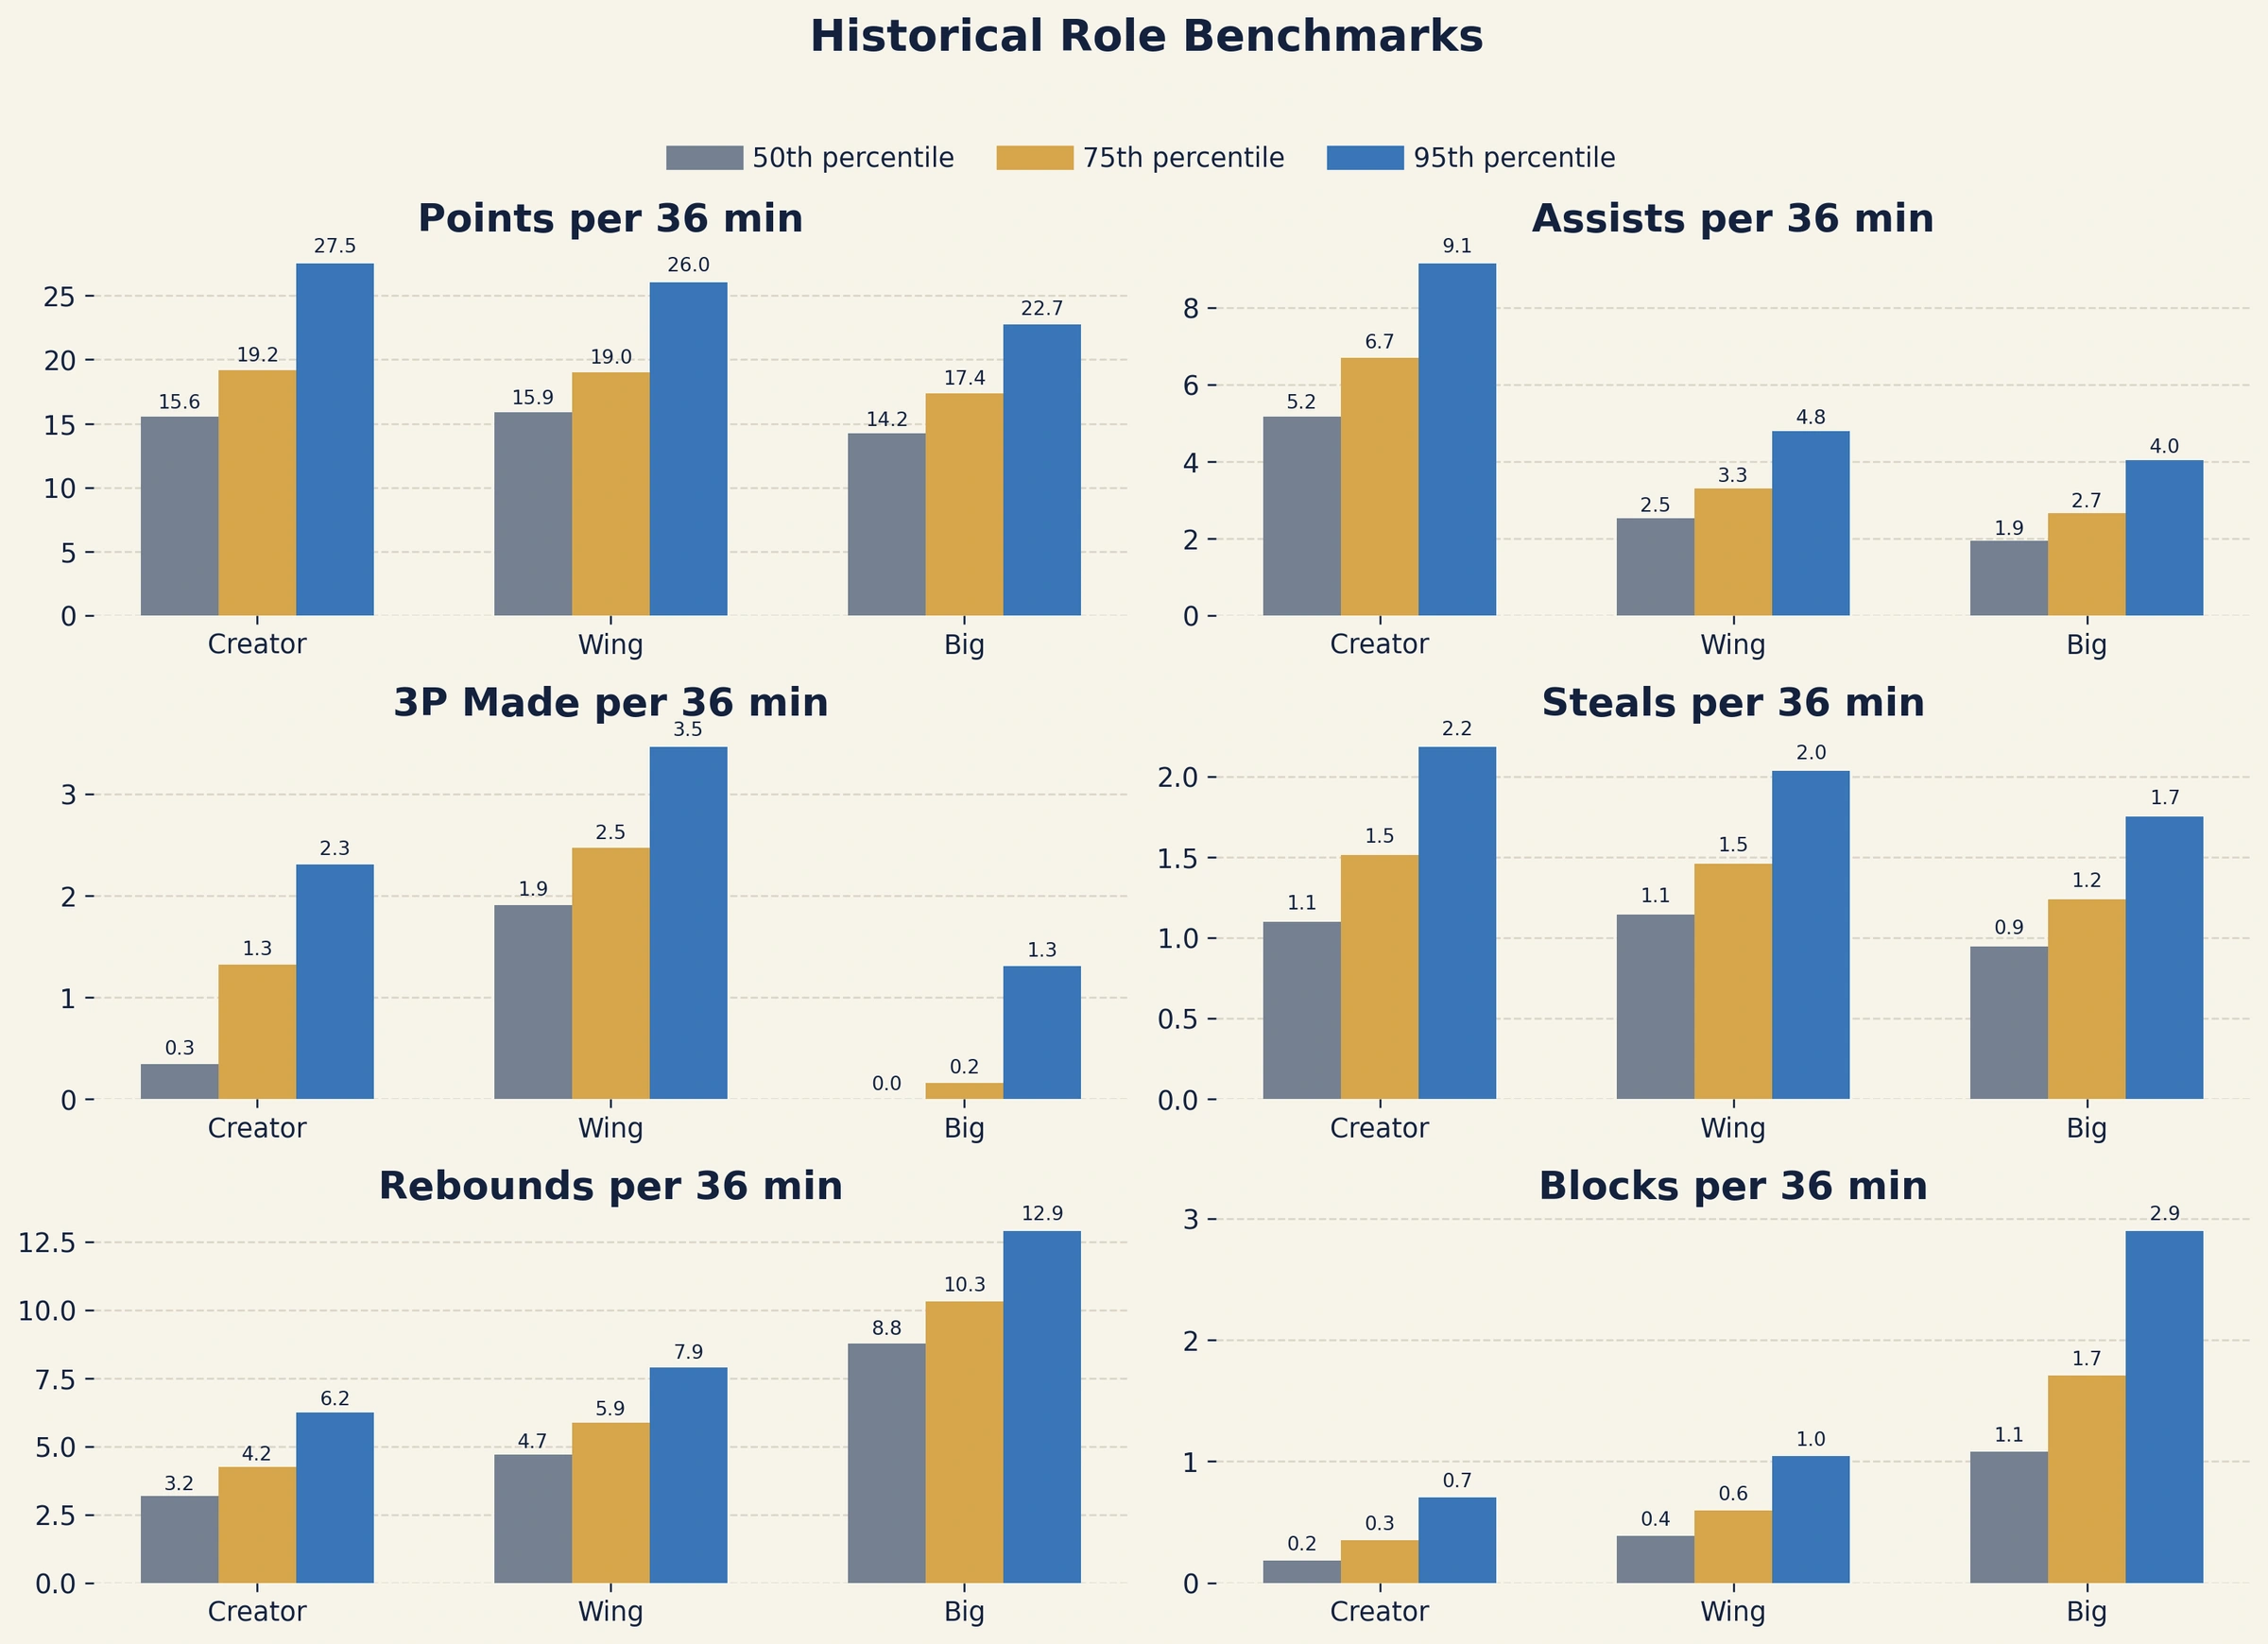
Original project chart: the 50th, 75th, and 95th percentiles for historical player-seasons, grouped by role and normalized to 36 minutes.
View full-size role-benchmark chartWhat the tiers mean
The benchmark population used player-seasons with at least 750 minutes and 30 games. Creator, Wing, and Big roles had historical reference tiers at the 50th, 75th, and 95th percentiles. Recency filtering selected the current-player pool separately; those players were graded against fixed historical tiers, not against one another. Multiple statistical indicators contribute to the assigned tier, so one standout statistic does not decide it.
What the tiers mean
The benchmark population used player-seasons with at least 750 minutes and 30 games. Creator, Wing, and Big roles had historical reference tiers at the 50th, 75th, and 95th percentiles. Recency filtering selected the current-player pool separately; those players were graded against fixed historical tiers, not against one another. Multiple statistical indicators contribute to the assigned tier, so one standout statistic does not decide it.
Recent seasons against a fixed historical reference
Selecting recent players and defining the reference population are separate decisions. I compare recent qualified player-seasons against the fixed historical tiers, rather than ranking those players only against one another. The database and benchmark rules make the comparison repeatable.
The historical baseline is not adjusted for era. The project also has unresolved links between database records and inconsistent team names. These limit the comparisons, which describe recorded performance and do not forecast future player value.